Tracking Instrument Calibration with a Digital Dashboard
Get overdue and due-soon status from the dates, not from a status column that can go out of date
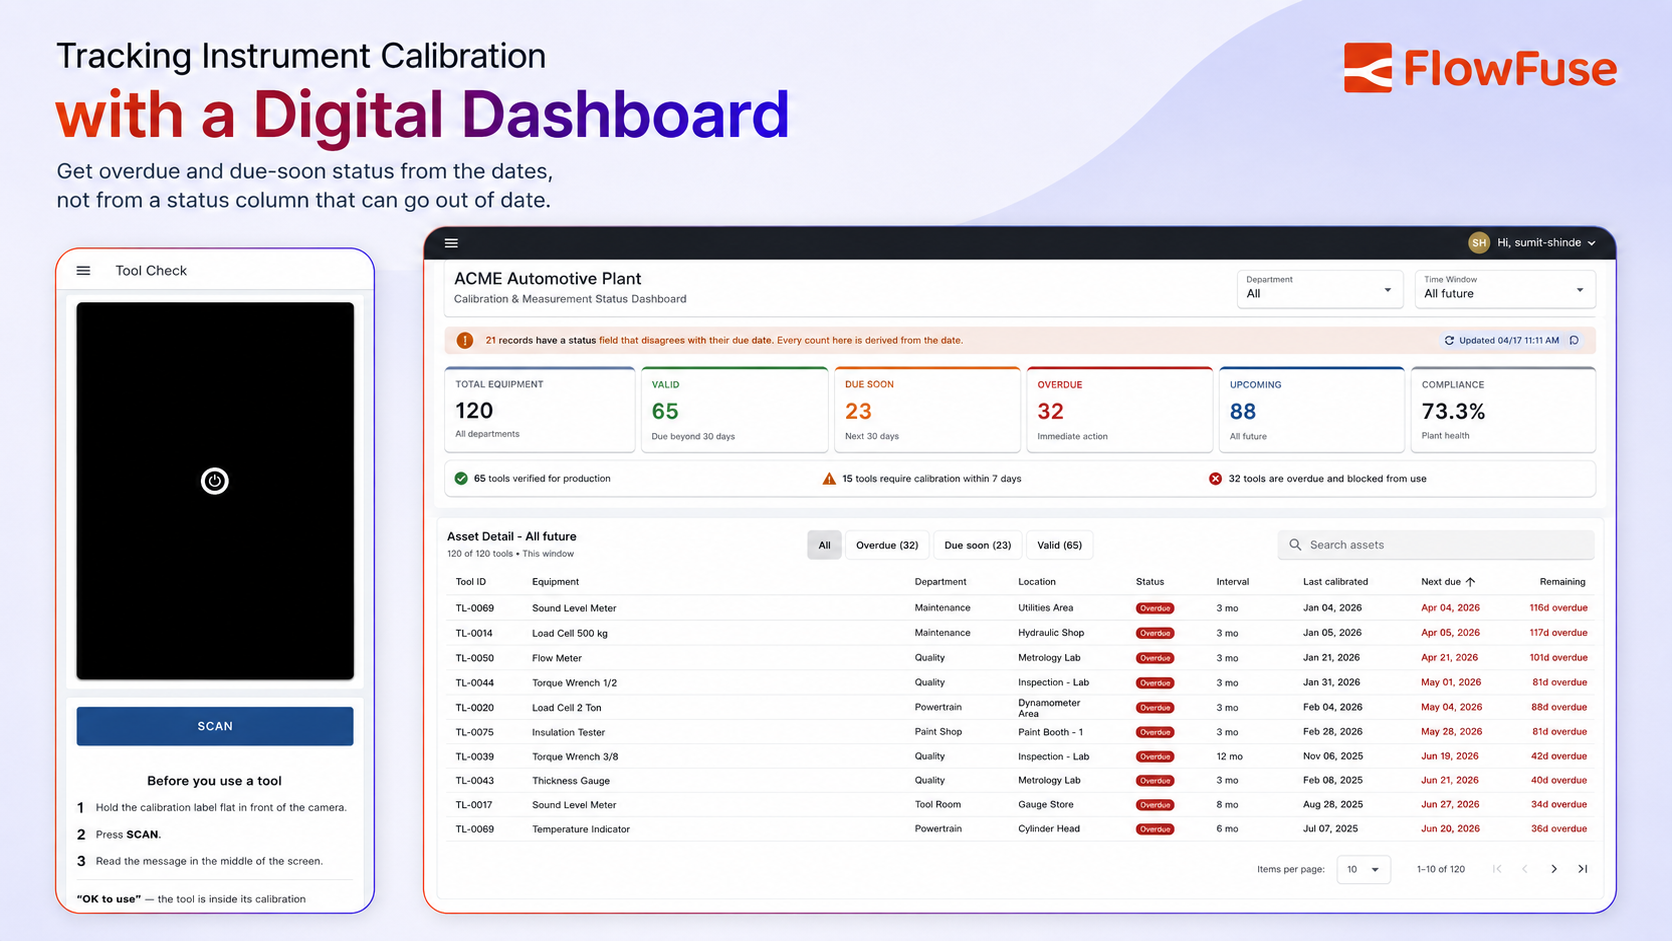
Build a FlowFuse calibration dashboard that works out overdue, due-soon and compliance figures from the due dates instead of a stored status column, filters by department and time window from the app bar, lists every instrument due in that window with days remaining, and gives operators a camera-based tool check at the station.
Most plants know their calibration status at two moments: when someone updates the spreadsheet, and when an auditor asks. The records already hold enough to do better than that: a last calibration date, an interval, and a next due date for every instrument.
Most registers also have a status field next to those dates, and reading it seems like the obvious move. But whatever writes that field can fall behind. Then the dashboard reports a compliant plant while due dates quietly pass. This build works out every figure from the due date instead, and counts how often the stored status disagrees with it.
For background on calibration records, including what they should contain, how calibration intervals are determined, and why overdue instruments matter, see What Is Instrument Calibration (Equipment Calibration)?.
A screen in the quality office is only half the job, though. The moment that matters is when someone picks up a torque wrench, and that person isn't looking at a dashboard. So the same check also runs behind a camera at the station: scan the label, get a verdict.
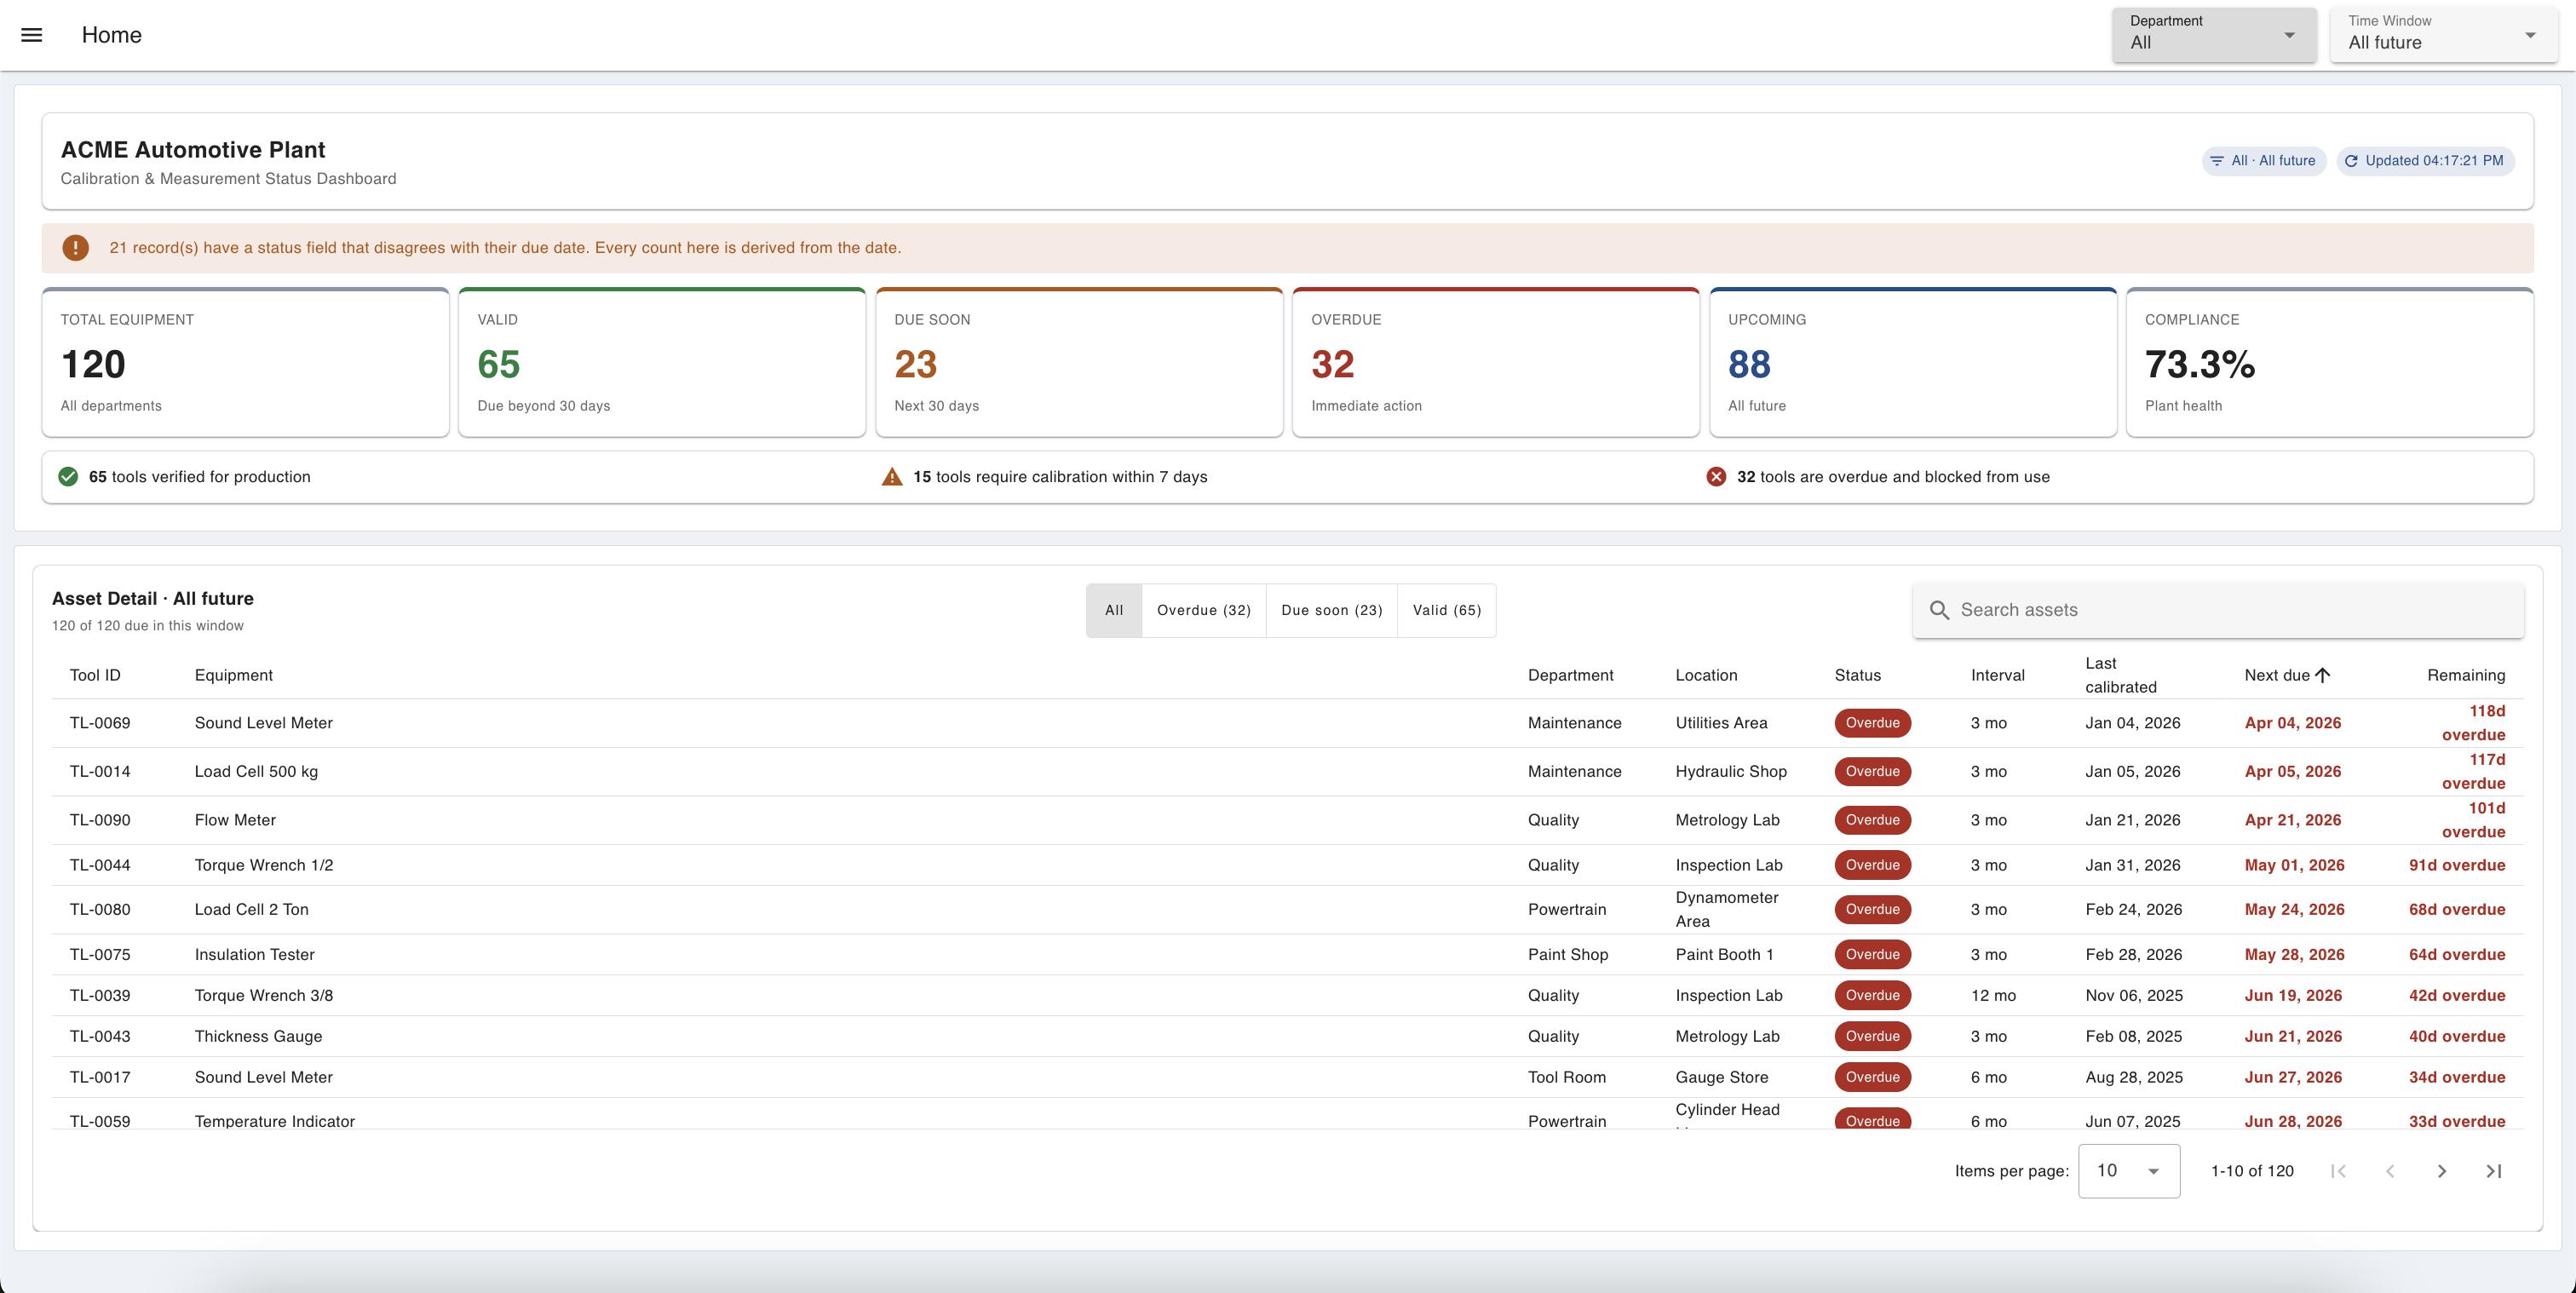
In this article, we'll build a calibration application in FlowFuse. It will show plant-level compliance figures, let you filter by department and time window, give an asset-level view of what's due and when, and offer a camera-based tool check for the shop floor.
Note: This tutorial reads from a
calibration_assetstable in FlowFuse Tables, filled with sample instruments. Everything here works the same against a real calibration register, a CMMS, or an ERP endpoint. Only the query nodes change.
You can interact with the live demo here: Try the Calibration Status Dashboard Demo.
What You'll Need
Before you start building, get these ready:
- A FlowFuse account. Sign up for FlowFuse Cloud, or use a self-hosted instance.
- A FlowFuse instance up and running. If you don't have one yet, create a new instance from your FlowFuse Platform.
- FlowFuse Dashboard installed. This tutorial uses
@flowfuse/node-red-dashboardnodes (ui-template,ui-event,ui-button,ui-markdown,ui-notification,ui-page,ui-group,ui-theme) to build both pages. Install it from the Palette Manager if it isn't already in your instance. - A webcam node and an OCR node. The Tool Check page uses
@sumit_shinde_84/node-red-dashboard-2-ui-webcamto capture the label and@sumit_shinde_84/node-red-contrib-simple-ocrto read it. Install both from the Palette Manager. - A device with a camera for the Tool Check page, since the scanner works through the browser.
Note: FlowFuse Tables is available to Enterprise tier teams on FlowFuse Cloud, and to Enterprise licensed self-hosted teams running on Kubernetes. If you're on a different tier, use any external database instead, such as Postgres or MySQL, with the standard database nodes from the palette. The SQL here is standard PostgreSQL, and the widgets only care about the shape of the rows, not where they came from.
How the Application Works
Before we build anything, let's walk through what the application does. There are two pages, and one idea holding them together.
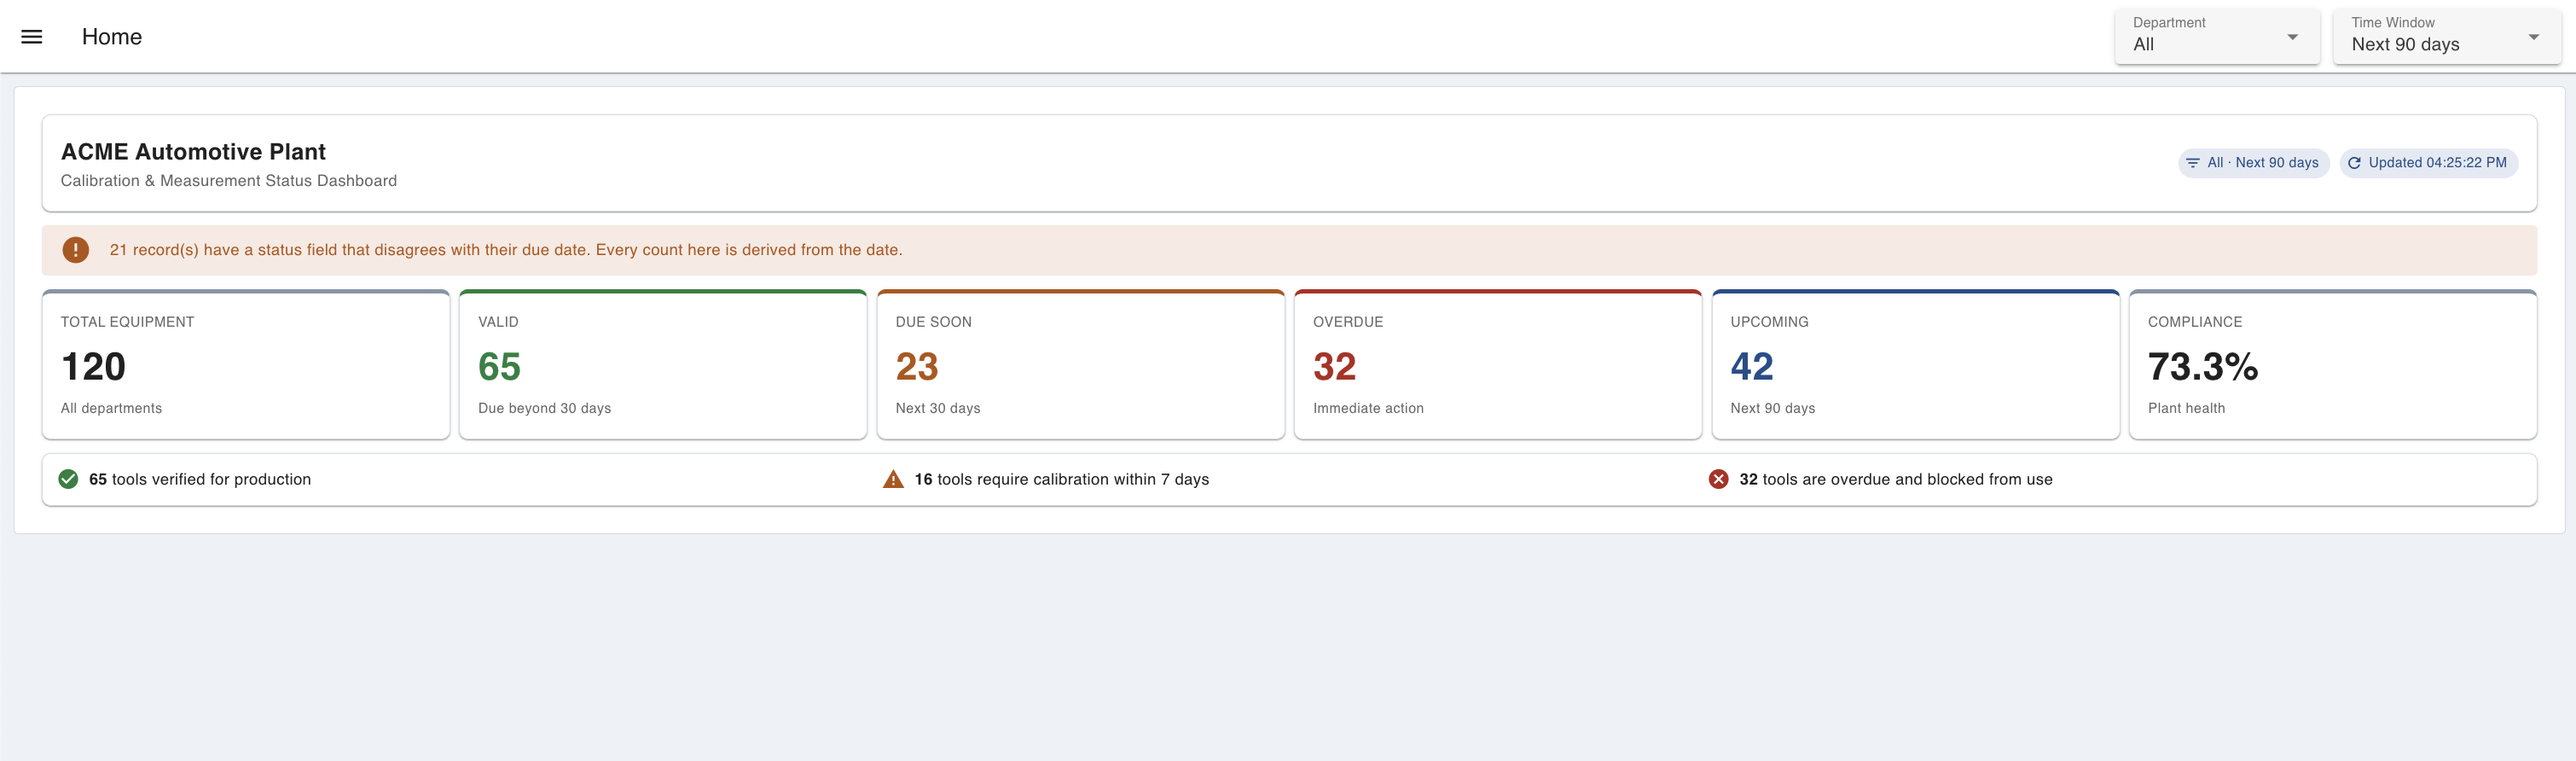
- Home. A quality engineer picks a department and how far ahead to look. Six figures across the top show how much equipment there is, and how much of it is valid, due soon, overdue, coming up in the chosen window, and compliant overall. Below that is a list of instruments due inside that window, most urgent first, each with its status, due date, and days remaining. The cards describe the whole register for the chosen department. Only the Upcoming figure and the table below respond to the time window.
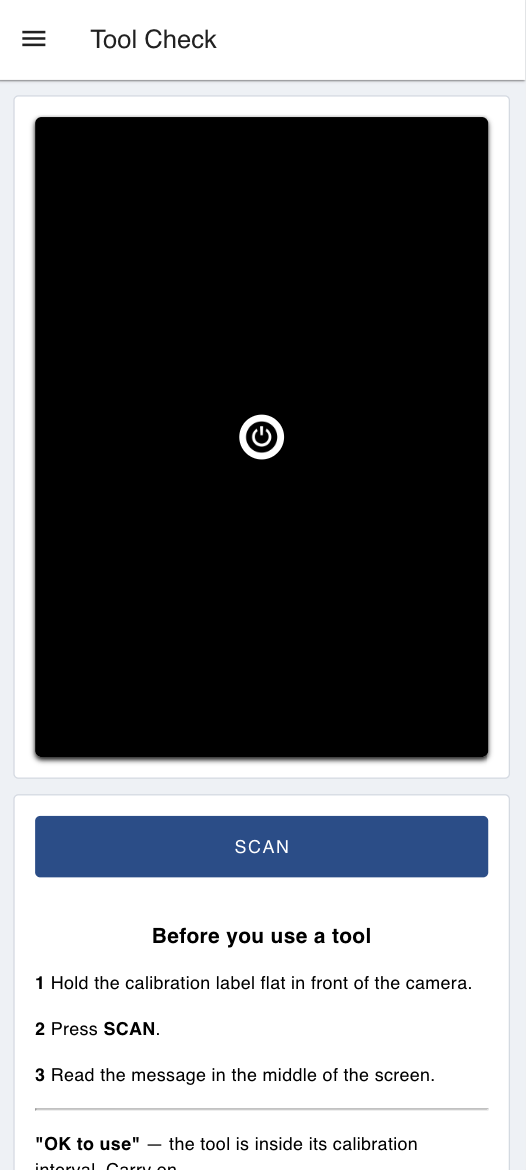
- Tool Check. An operator holds a calibration label up to the camera and presses SCAN. The app reads the tool ID off the label, looks it up, and shows an answer in the middle of the screen: OK to use, Do not use, Not in register, or Label not readable. No numbers to interpret and no dashboard to search through.
The due date is the single source of truth for the whole application. Every KPI figure, every status chip in the table, and the scanner's verdict all come from comparing that date to the current time. That is what stops the office screen and the station gate from ever telling two different stories about the same tool.
Importing the Simulated Flow
Instead of pointing the application at a live calibration register, we'll generate one.
- Import the following flow into FlowFuse and click Deploy.
- Click the trigger on Create Table, then the trigger on Generate & Insert Automotive Calibration Dataset. Drop Table is there for when you want to start over from scratch.
That gives you 120 instruments with IDs from TL-0001 to TL-0120, spread across eight departments: roughly 70% valid, 20% due soon, and 10% overdue. The eight department names are the same ones the filter dropdown offers later.
Everything we build reads from these columns:
| Column | What the application does with it |
|---|---|
tool_id |
Primary key, and the ID printed on the calibration label that the scanner matches against |
next_due_ts |
Every status figure, chip, and scanner verdict comes from comparing this against the current time |
status |
The stored label. We deliberately don't trust it, and use it only to spot drift from the dates |
department |
Drives the Department filter on the dashboard |
equipment_name |
Names the instrument in the table and in the scanner verdict |
location, calibration_interval_months, last_calibration_ts |
Table columns |
serial_number, calibration_lab, certificate_no, created_at |
Kept for reference; nothing in this build shows them |
Note: Your register will likely name these columns differently. Alias your columns in the
SELECTlist, as inSELECT gauge_ref AS tool_id, cal_due_date AS next_due_ts, ..., and every widget will still work. Only the due-date column is essential.
Before running the generator, set its reference date near the top of the function, const today = new Date('2026-07-28T10:00:00'), to roughly today's date. Otherwise everything will land relative to a date in the past.
Setting Up the Dashboard Layout
The application has two pages and four groups. Most widgets sit inside a named group. The filter bar is scoped to the page instead, because it appears in the app bar rather than in the grid. See the Dashboard layout docs if you're new to how pages, groups, and bases relate.
-
Create two ui-page nodes. The Dashboard automatically creates a base dashboard the first time you add a Dashboard node to the canvas.
- Home (path:
/home): the calibration status dashboard. Set the layout to Grid. - Tool Check (path:
/tool-check): the scanner. Set the layout to Notebook.
- Home (path:
-
On the Home page, create two ui-group nodes, both 12 columns wide with Show title turned off:
- KPIs (order 1)
- Asset Detail (order 2)
-
On the Tool Check page, create two more ui-group nodes, also 12 columns wide with titles off:
- Scanner (order 1)
- Verdict (order 2)
-
Open the ui-base node and set Header Content to page. This shows the app bar, which the filter widget needs.
-
Set up the ui-theme to suit your needs. The dashboard already comes with a default theme, which you can use for now.
Building the Filter Bar
Two controls drive the page: which department, and how far ahead to look. Both sit in the app bar rather than the grid, so no row of the page is used up by a dropdown.
The department list is read from the register itself, not typed in by hand, so adding a department next year doesn't mean editing a flow. The time windows are fixed, because "next 30 days" is a choice this application makes rather than something the data tells you.
-
Add a
ui-eventnode named "Page Load / Refresh Event" and select your "My Dashboard" ui-base. It fires whenever a page loads. -
Add a
tables-querynode named "Load Departments":
Tip: You don't have to write the SQL yourself either. Use FlowFuse Expert and describe what you want the query to return in plain English, and it will generate the SQL for you.
SELECT DISTINCT department
FROM calibration_assets
WHERE department IS NOT NULL
  AND btrim(department) <> ''
ORDER BY department;- Import the App Header Filters
ui-templatebelow, set its type to Widget (Page-Scoped), select the Home page, and turn off Pass through messages from input to output. The complete component is provided below, so there's no need to build it yourself. It shows two dropdowns in the header using Vue's Teleport: Department, filled from the query above, and Time Window. It opens on All departments and Next 90 days, sends{ department, timeWindow }on every change, and sends the same on load so the dropdowns and the data always agree.
Tip: Whenever you need a custom Dashboard widget, you don't have to write the Vue code yourself. Use FlowFuse Expert and describe the widget in plain English, and it will generate the
ui-templatefor you.
-
Add a
changenode named "Save Filters to Global Context" and set the persistent globalfilterstomsg.payload. -
Add a
link outnode named "Filters Changed". This is what makes the page respond right away. Changing a dropdown writes the new selection to context, but nothing would redraw until the next poll tick, so the operator would be looking at stale numbers for up to fifteen seconds. The link carries the change straight into the next flow, which re-runs its query and refreshes the page. -
Wire the nodes: Page Load / Refresh Event → Load Departments → App Header Filters → Save Filters to Global Context → Filters Changed.

Working Out the KPI Figures from the Due Dates
This is where we stop using the register's status column. Every figure on the page comes from comparing next_due_ts against the current time, and one extra count reports how often the stored status disagrees with that comparison.
-
Add an
injectnode named "Poll Data (15 sec)", set it to repeat every 15 seconds and to fire once shortly after deploy, so the page has data before the first tick. -
Add a
link innode named "Filters Changed" and point it at the link out from the filter bar. -
Add a
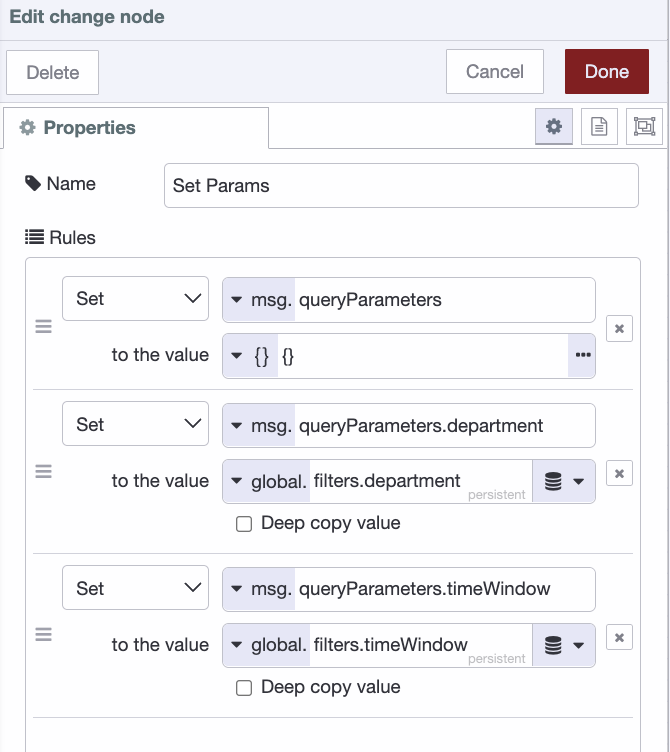
changenode named "Set Params". This maps the saved filters onto the$departmentand$timeWindowparameters the SQL reads. Set three rules, in order:- Set
queryParametersto{}(JSON): starts clean so old values don't linger. - Set
queryParameters.departmenttofilters.department(global persistent). - Set
queryParameters.timeWindowtofilters.timeWindow(global persistent).
- Set
- Add a
tables-querynode named "KPI Query":
SELECT
    -- Sent back so the cards label themselves from the data on screen,
    -- not from whatever the dropdowns happen to show. COALESCE covers the
    -- first poll after deploy, before any browser has sent a selection.
    COALESCE($department::text, 'All')          AS filter_department,
    COALESCE($timeWindow::text, 'Next 90 days') AS filter_window,

    COUNT(*) AS total_assets,

    -- Buckets worked out from next_due_ts instead of the stored status column,
    -- which drifts whenever whatever writes it falls behind. These three
    -- don't overlap, and add up to total_assets. The 30-day threshold is a
    -- policy decision, not a view setting: it does not change with the dropdown.
    COUNT(*) FILTER (
        WHERE next_due_ts > NOW() + INTERVAL '30 days'
    ) AS valid_assets,

    COUNT(*) FILTER (
        WHERE next_due_ts >= NOW()
          AND next_due_ts <= NOW() + INTERVAL '30 days'
    ) AS due_soon_assets,

    COUNT(*) FILTER (
        WHERE next_due_ts < NOW()
    ) AS overdue_assets,

    -- The only figure the Time Window dropdown affects. It sends a label, so
    -- it maps to an interval here; ELSE also catches an unrecognised label.
    COUNT(*) FILTER (
        WHERE next_due_ts >= NOW()
          AND next_due_ts <= NOW() + (
              CASE COALESCE($timeWindow::text, 'Next 90 days')
                  WHEN 'Next 7 days'  THEN INTERVAL '7 days'
                  WHEN 'Next 30 days' THEN INTERVAL '30 days'
                  WHEN 'Next 90 days' THEN INTERVAL '90 days'
                  WHEN 'All future'   THEN INTERVAL '100 years'
                  ELSE INTERVAL '90 days'
              END
          )
    ) AS due_in_window,

    COUNT(*) FILTER (
        WHERE next_due_ts BETWEEN NOW()
                            AND NOW() + INTERVAL '7 days'
    ) AS due_next_7_days,

    -- Compliance means "inside its calibration interval", which includes
    -- tools due soon, since they have not expired yet.
    ROUND(
        COUNT(*) FILTER (WHERE next_due_ts >= NOW()) * 100.0
        / NULLIF(COUNT(*), 0),
        1
    ) AS valid_percentage,

    -- Counts records where the stored status and the live date disagree, so
    -- the drift shows up on the dashboard instead of staying hidden.
    COUNT(*) FILTER (
        WHERE (status = 'Overdue') <> (next_due_ts < NOW())
    ) AS stale_status_count

FROM calibration_assets
-- Driven by the Department dropdown; 'All' turns the filter off.
WHERE (COALESCE($department::text, 'All') = 'All'
       OR department = $department::text);
stale_status_count is the figure worth watching. It counts the rows where the stored status and the due date disagree, which is the number that justifies leaving the status column out of every other calculation.
-
Add a
link outnode named "Refresh Asset Table" and wire it from Set Params, so the table below runs on the same selection instead of working it out again. -
Import the KPI Cards
ui-templatebelow and assign it to the KPIs group. The complete component is provided below, so there's no need to build it yourself. It shows a header with the active filter and a last-updated time, six cards for total equipment, valid, due soon, overdue, upcoming and compliance, and a three-line summary strip. Whenstale_status_countis above zero it also shows a warning banner naming the number of drifted records.
- Wire the nodes: Poll Data (15 sec) → Set Params → KPI Query → KPI Cards, and Filters Changed → Set Params.
Deploy and open /home. The six cards fill in, and on the seeded data the drift banner should appear right away, because the generator creates records whose stored status no longer matches their due date.
Listing Every Instrument with Days Remaining
The cards tell a supervisor how much is overdue. This table tells them which tools, so someone can actually go and collect them. It's a worklist rather than a full register dump, which is why the time window scopes it down.
-
Add a
link innode named "Refresh Asset Table" and point it at the link out from the KPI flow. Taking the filters from that message instead of reading context again is what keeps the table and the cards working from the same selection. -
Add a
tables-querynode named "Asset Rows":
SELECT
    -- Sent back so the table can state its own scope in the header.
    COALESCE($timeWindow::text, 'Next 90 days') AS filter_window,

    tool_id,
    equipment_name,
    department,
    location,
    serial_number,

    -- Same 30-day policy threshold as the KPI buckets, so a tool never reads
    -- one status here and another elsewhere. The bare column name still
    -- refers to the table column.
    CASE
        WHEN next_due_ts < NOW() THEN 'Overdue'
        WHEN next_due_ts <= NOW() + INTERVAL '30 days' THEN 'DueSoon'
        ELSE 'Valid'
    END AS status,
    status AS stored_status,

    last_calibration_ts,
    next_due_ts,
    calibration_interval_months,
    calibration_lab,
    certificate_no,

    -- Negative for anything already past due, which the widget shows as
    -- "12d overdue" rather than "-12d".
    (next_due_ts::date - CURRENT_DATE) AS days_remaining

FROM calibration_assets

-- This is a worklist, not the whole register: the window scopes it to what
-- needs attention. Overdue tools have a past due date, so the upper bound
-- already includes them; no separate clause needed.
WHERE (COALESCE($department::text, 'All') = 'All'
       OR department = $department::text)
  AND next_due_ts <= NOW() + (
      CASE COALESCE($timeWindow::text, 'Next 90 days')
          WHEN 'Next 7 days'  THEN INTERVAL '7 days'
          WHEN 'Next 30 days' THEN INTERVAL '30 days'
          WHEN 'Next 90 days' THEN INTERVAL '90 days'
          WHEN 'All future'   THEN INTERVAL '100 years'
          ELSE INTERVAL '90 days'
      END
  )

ORDER BY next_due_ts ASC
LIMIT 500;
Sorting by due date ascending puts the worst offenders at the top, which is the only order that makes a calibration list useful. stored_status is included but not used by the widget, so it's there when you want to see exactly which records have drifted rather than just how many.
- Import the Asset Table
ui-templatebelow and assign it to the Asset Detail group. The complete component is provided below, so there's no need to build it yourself. It shows a Vuetify data table with a status chip per row, formatted dates, and days remaining shown as "12d overdue" or "due today". Its header names the active window, so it's clear the list is scoped rather than the full register. Above the table sit a search box and a status toggle with live counts for Overdue, Due soon and Valid, filtering the rows already on the page without hitting the database again. The Department column hides itself when every row belongs to the same department, since a single-department view makes it a fixed value.
- Wire the nodes: Refresh Asset Table → Asset Rows → Asset Table.
Deploy and open /home. The table fills in below the cards, most urgent first, with its header naming the window it covers. Change a dropdown and both halves of the page update together.
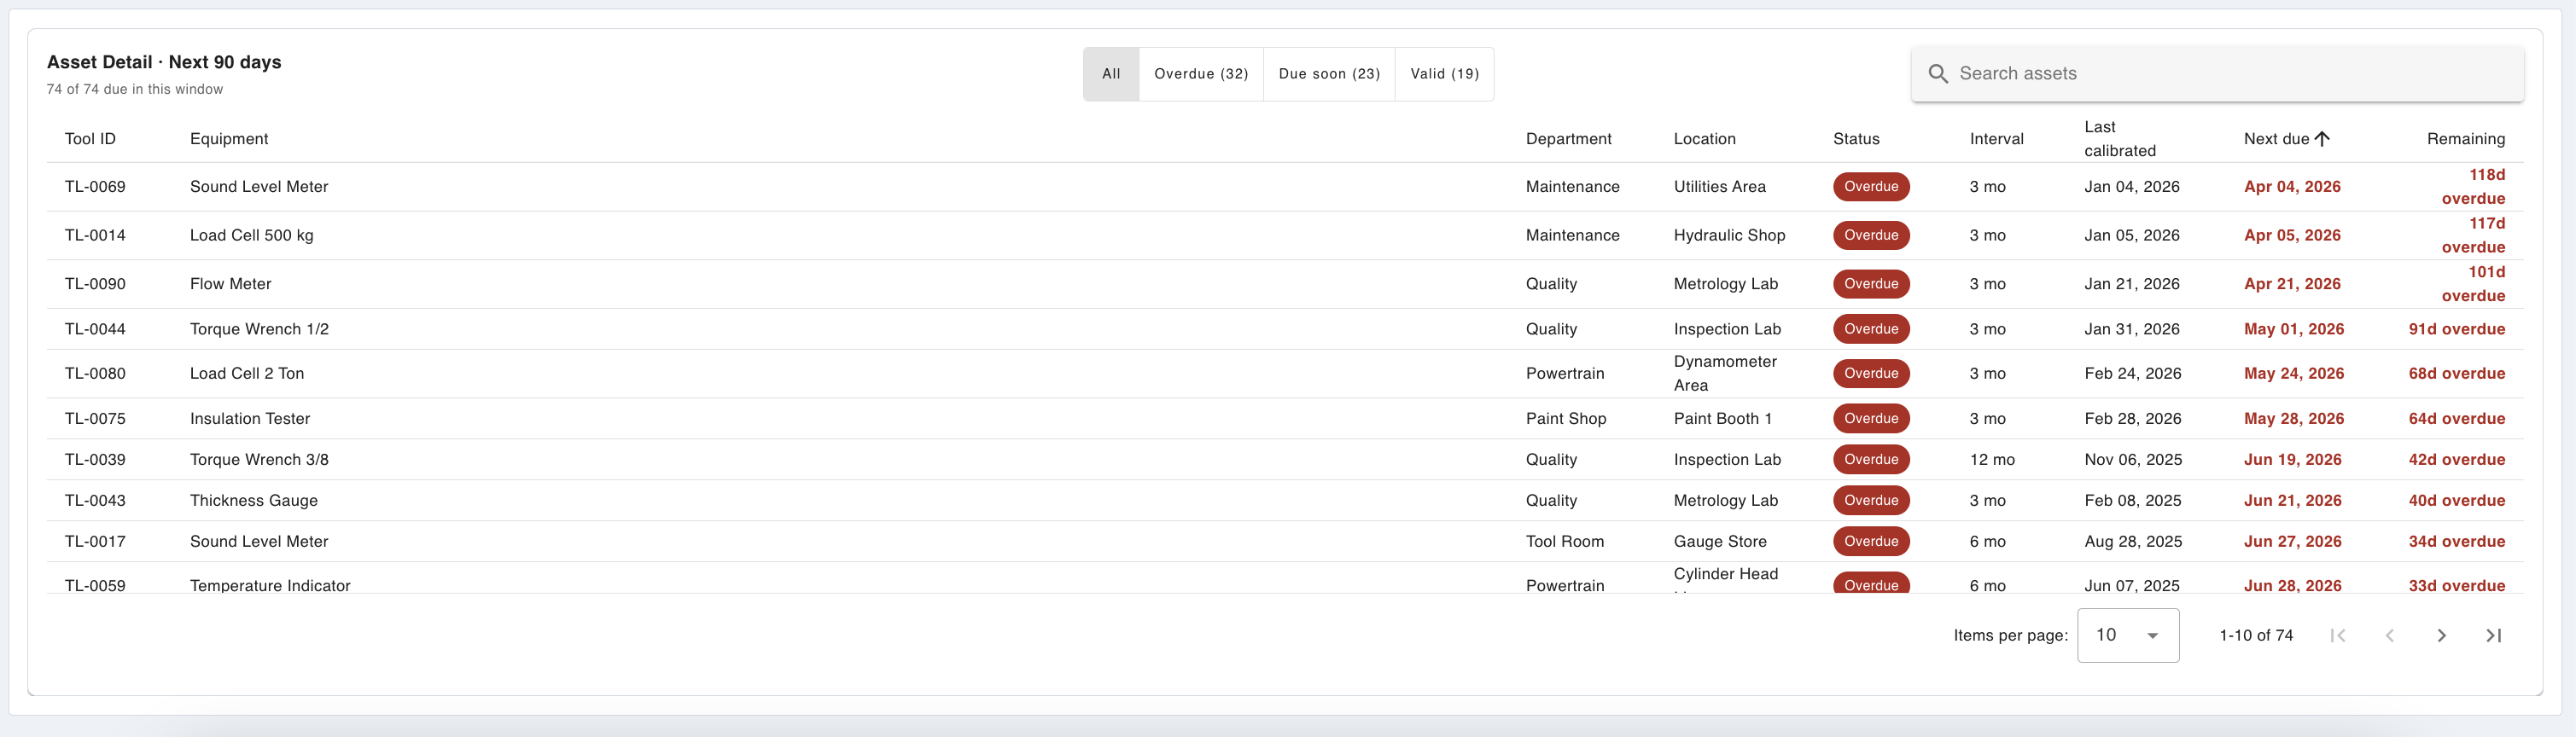
Note: The toggle counts describe the table, not the register, so they will read lower than the cards above. That's the point of the split: the cards answer "how are we doing," and the table answers "what needs collecting." Select All future and the two match.
Checking a Tool at the Station
A dashboard in the quality office doesn't reach the person about to pick up a torque wrench. This page does: hold the calibration label to a camera, press one button, get one answer.
-
Add a
ui-buttonnode named "Scan Label Button" in the Verdict group, order 1. Set the label toSCANand the payload to the stringcapture, which tells the webcam to take a frame. -
Add a
ui-webcamnode in the Scanner group, with Pass through and QR detection both off. Leave image width, height and quality blank to use the camera's defaults. -
Add a
changenode that setsmsg.payloadtomsg.payload.image. The webcam outputs an object; the OCR node just needs the image. -
Add a
simple-ocrnode, then alink out/link inpair to carry the result down to the next row of the canvas.
Tip: OCR keeps this tutorial hardware-free, but if your labels have a barcode or QR code, scanning one is faster and far more reliable than reading printed text. Swap the camera and OCR nodes for a barcode scanner and feed the decoded ID straight into "Set Tool ID," and everything downstream will keep working. You can also drop "Extract Tool ID" and "Scan Valid?", since a scanner either returns an ID or nothing.
- Add a
functionnode named "Extract Tool ID":
Tip: The same goes for function node logic. Describe what you want the function to do in plain English, and FlowFuse Expert will generate the code for you.
// Stickers read TL followed by four digits. OCR loses the hyphen and swaps
// look-alike characters, so normalise before matching.
const text = String(msg.payload?.text || msg.payload || '');
const flat = text.toUpperCase().replace(/[^A-Z0-9]/g, '');

const FIXES = { O: '0', Q: '0', I: '1', L: '1', S: '5', B: '8', Z: '2', G: '6' };

const m = flat.match(/T[L1I]([A-Z0-9]{4})/);
const digits = m ? m[1].replace(/[A-Z]/g, c => FIXES[c] || c) : '';
const toolId = /^\d{4}$/.test(digits) ? 'TL-' + digits : null;

msg.payload = {
    success: !!toolId,
    toolId,
    // Shows what OCR actually read when a scan fails.
    rawText: text.replace(/\s+/g, ' ').trim()
};
return msg;
Wire a debug node to this as well and leave it enabled. When a scan fails, rawText shows what the camera actually read, which is the difference between fixing the label and guessing at it.
Note: The pattern above expects
TLfollowed by four digits, because that's what the seeded data uses. Your labels almost certainly look different: a different prefix, more digits, a plant code, or no letters at all. Change the regex and the length check to match your own sticker format before you test this on real tools, or every scan will come back as Label not readable.
-
Add a
switchnode named "Scan Valid?" onpayload.success, with is true on the first output and otherwise on the second. A failed read skips the database entirely. -
Add a
changenode named "Set Tool ID" on the true branch, with two rules:- Set
queryParametersto the JSONata{ "toolId": $trim(payload.toolId) } - Set
scannedIdto the JSONata$trim(payload.toolId), so the ID survives to the verdict even when no row comes back
- Set
-
Add a
tables-querynode named "Look Up Tool":
SELECT
    tool_id,
    equipment_name,

    -- The safety answer comes from the date, not the stored status flag,
    -- which can go stale if whatever recalculates it falls behind.
    (next_due_ts >= NOW()) AS ok_to_use

FROM calibration_assets

-- Deliberately NOT filtered by department or time window: a scan is a
-- lookup of one tool, not a view. Case, padding and hyphens are all
-- normalised away, at the cost of the index, which is fine at register size.
WHERE replace(upper(btrim(tool_id)), '-', '')
= replace(upper(btrim($toolId)), '-', '');- Add a
functionnode named "Build Verdict". Wire both the query output and the switch's second output into it:
// Two paths feed this node: a completed lookup, and a failed scan routed
// straight past the query. Tell them apart by payload shape.
const p = msg.payload;

if (p?.success === false) {
    msg.payload = { state: 'scan_failed' };
    return msg;
}

const row = Array.isArray(p) ? p[0] : p;

if (!row?.tool_id) {
    msg.payload = { state: 'not_found', scannedId: msg.scannedId };
    return msg;
}

msg.payload = {
    state: row.ok_to_use ? 'ok' : 'blocked',
    tool: row
};
return msg;
Four states come out of it, and they're the only four an operator ever sees:
| State | When | Verdict |
|---|---|---|
ok |
Due date in the future | OK to use, green |
blocked |
Due date has passed | Do not use, red |
not_found |
ID read, no matching row | Not in register, amber |
scan_failed |
No TL-#### pattern found |
Label not readable, amber |
- Add a
functionnode named "Format Notification". It shows what was scanned, the verdict, and what to do about it:
const v = msg.payload || {};
const t = v.tool;
// timeout 0 on 'blocked' is deliberate: an expired-tool verdict must be
// dismissed by a person, not fade out while nobody is watching.
const VERDICTS = {
ok: { text: 'OK to use', do: 'Carry on.', color: '#15803d', timeout: 8 },
blocked: { text: 'Do not use', do: 'Tag it and tell your supervisor.', color: '#b3261e', timeout: 0 },
not_found: { text: 'Not in register', do: 'Tell your supervisor.', color: '#b45309', timeout: 12 },
scan_failed: { text: 'Label not readable', do: 'Wipe the label and scan again.', color: '#b45309', timeout: 8 }
};
const cfg = VERDICTS[v.state] || VERDICTS.scan_failed;
// ui-notification renders raw HTML, so escape what came from the register.
const esc = s => String(s ?? '').replace(/[<>&"]/g,
c => ({ '<': '<', '>': '>', '&': '&', '"': '"' }[c]));
const scanned = t
? esc(t.tool_id) + ' - ' + esc(t.equipment_name)
: esc(v.scannedId || 'No ID read');
msg.payload = `<div style="font-size:1rem;opacity:.85">${scanned}</div>`
+ `<div style="font-size:2rem;font-weight:700;margin:4px 0">${cfg.text}</div>`
+ `<div style="font-size:1rem">${cfg.do}</div>`;
msg.color = cfg.color;
msg.timeout = cfg.timeout;
return msg;-
Add a
ui-notificationnode named "Verdict" and select your ui-base. Set Position to center center, turn off Use default colour, turn on Show countdown, Allow dismiss and Allow raw HTML. The display time and colour on the node are only fallbacks;msg.timeoutandmsg.coloroverride them for each verdict. -
Add a
ui-markdownnode named "Tool Check Instructions" in the Verdict group, order 2:
<div style="text-align: center">

### Before you use a tool

</div>

**1** Hold the calibration label flat in front of the camera.

**2** Press **SCAN**.

**3** Read the message in the middle of the screen.

---

**"OK to use"**: the tool is inside its calibration interval. Carry on.

**"Do not use"**: set the tool aside, tag it, and tell your supervisor. If you have already used it on parts today, say so; those measurements need checking.

**"Not in register"** or **"Label not readable"**: wipe the label and scan again. If it fails twice, tell your supervisor.

---

Anything other than **"OK to use"** means the tool stays out of production.- Wire the nodes: Scan Label Button → ui-webcam → change → simple-ocr → Extract Tool ID → Scan Valid?, then Scan Valid? (true) → Set Tool ID → Look Up Tool → Build Verdict, and Scan Valid? (otherwise) → Build Verdict → Format Notification → Verdict.
Deploy and open /tool-check on a device with a camera. Hold a label reading TL-0007, or one in whatever format you configured above, in front of it and press SCAN. Whatever the seeded data says about that tool is what comes back. Because the verdict compares the date instead of reading the status column, it will always agree with the Home page.
What Next
You've built a calibration application that answers two different questions from the same data. The office screen tells a quality engineer how the plant stands and what needs collecting this week. The station screen tells an operator whether the tool in their hand is fit to use. Both read the due date, so neither can drift from the other.
Right now it runs on generated data. To go live, remove the simulator flow and point the queries at your own register. Just alias your column names in the SELECT lists, and everything downstream keeps working. If your records sit in a CMMS or ERP behind an API, swap the query nodes for http request nodes and nothing else changes. From there, the obvious next steps are ones the register already supports: email the overdue list to the calibration lab each Monday, or notify someone the moment a critical gauge goes overdue instead of waiting for a screen to be looked at. The same approach works for defect tracking and downtime too. See how manufacturers are using it on our automotive solutions page.
See What Your Team Can Build
See it live with our team, and the variety of applications you can build without coding expertise, then scale them across your plant in a single click.
Frequently Asked Questions
About the Author
Sumit Shinde
Technical Writer
Sumit Shinde is a Technical Writer at FlowFuse specializing in industrial automation and manufacturing. In the past three years, he has built industrial applications and authored more than 100 technical articles covering industrial connectivity, unified data architecture, production metrics, and quality management for modern manufacturing.
Table of Contents
Like what you’re reading?
Add FlowFuse as a preferred sourceOn the page that opens, check the box next to flowfuse.com to see more of our articles in your Google Search results.
Related Articles:
- Build a Defect Tracking and Quality Monitoring Dashboard
- What Is Instrument Calibration (Equipment Calibration)?
- Ishikawa Fishbone Diagram: 6M, Manufacturing Example & Template
- Building Digital Work Instructions Dashboard for the Shop Floor
- Handling Clock Drift in Distributed Edge Devices