- Documentation
- FlowFuse User Manuals
- Using FlowFuse
- Getting Started
- Static asset service
- Bill of Materials
- FlowFuse Concepts
- Instance States
- Changing the Stack
- Custom Hostnames
- Custom Node Packages
- Dashboards
- DevOps Pipelines
- Environment Variables
- FlowFuse Expert
- FlowFuse File Nodes
- FlowFuse MQTT Nodes
- FlowFuse Persistent Context
- FlowFuse Project Nodes
- FlowFuse Tables
- Groups
- High Availability mode
- HTTP Access Tokens
- Instance Settings
- Logging
- Role-Based Access Control
- Shared Team Library
- Snapshots
- Team Broker
- Teams
- User Settings
- FlowFuse API
- Migrating a Node-RED project to FlowFuse
- Device Agent
- Device Agent
- Hardware Guides
- FlowFuse Cloud
- FlowFuse Cloud
- FlowFuse Self-Hosted
- Quick Start
- Installing FlowFuse
- Upgrading FlowFuse
- Administering FlowFuse
- Support
- Community Support
- Premium Support
- Debugging Node-RED issues
- Contributing
- Contributing to FlowFuse
Dashboards
Any hosted instance running the FlowFuse Dashboard can be viewed directly inside FlowFuse, without opening a separate browser tab.
This does not apply to Remote Instances (devices) - Dashboards are only listed and viewable here for hosted instances.
Team Dashboards
Click Dashboards in the Team navigation to see every hosted instance in the Team that has a Dashboard installed, regardless of which Application it belongs to.
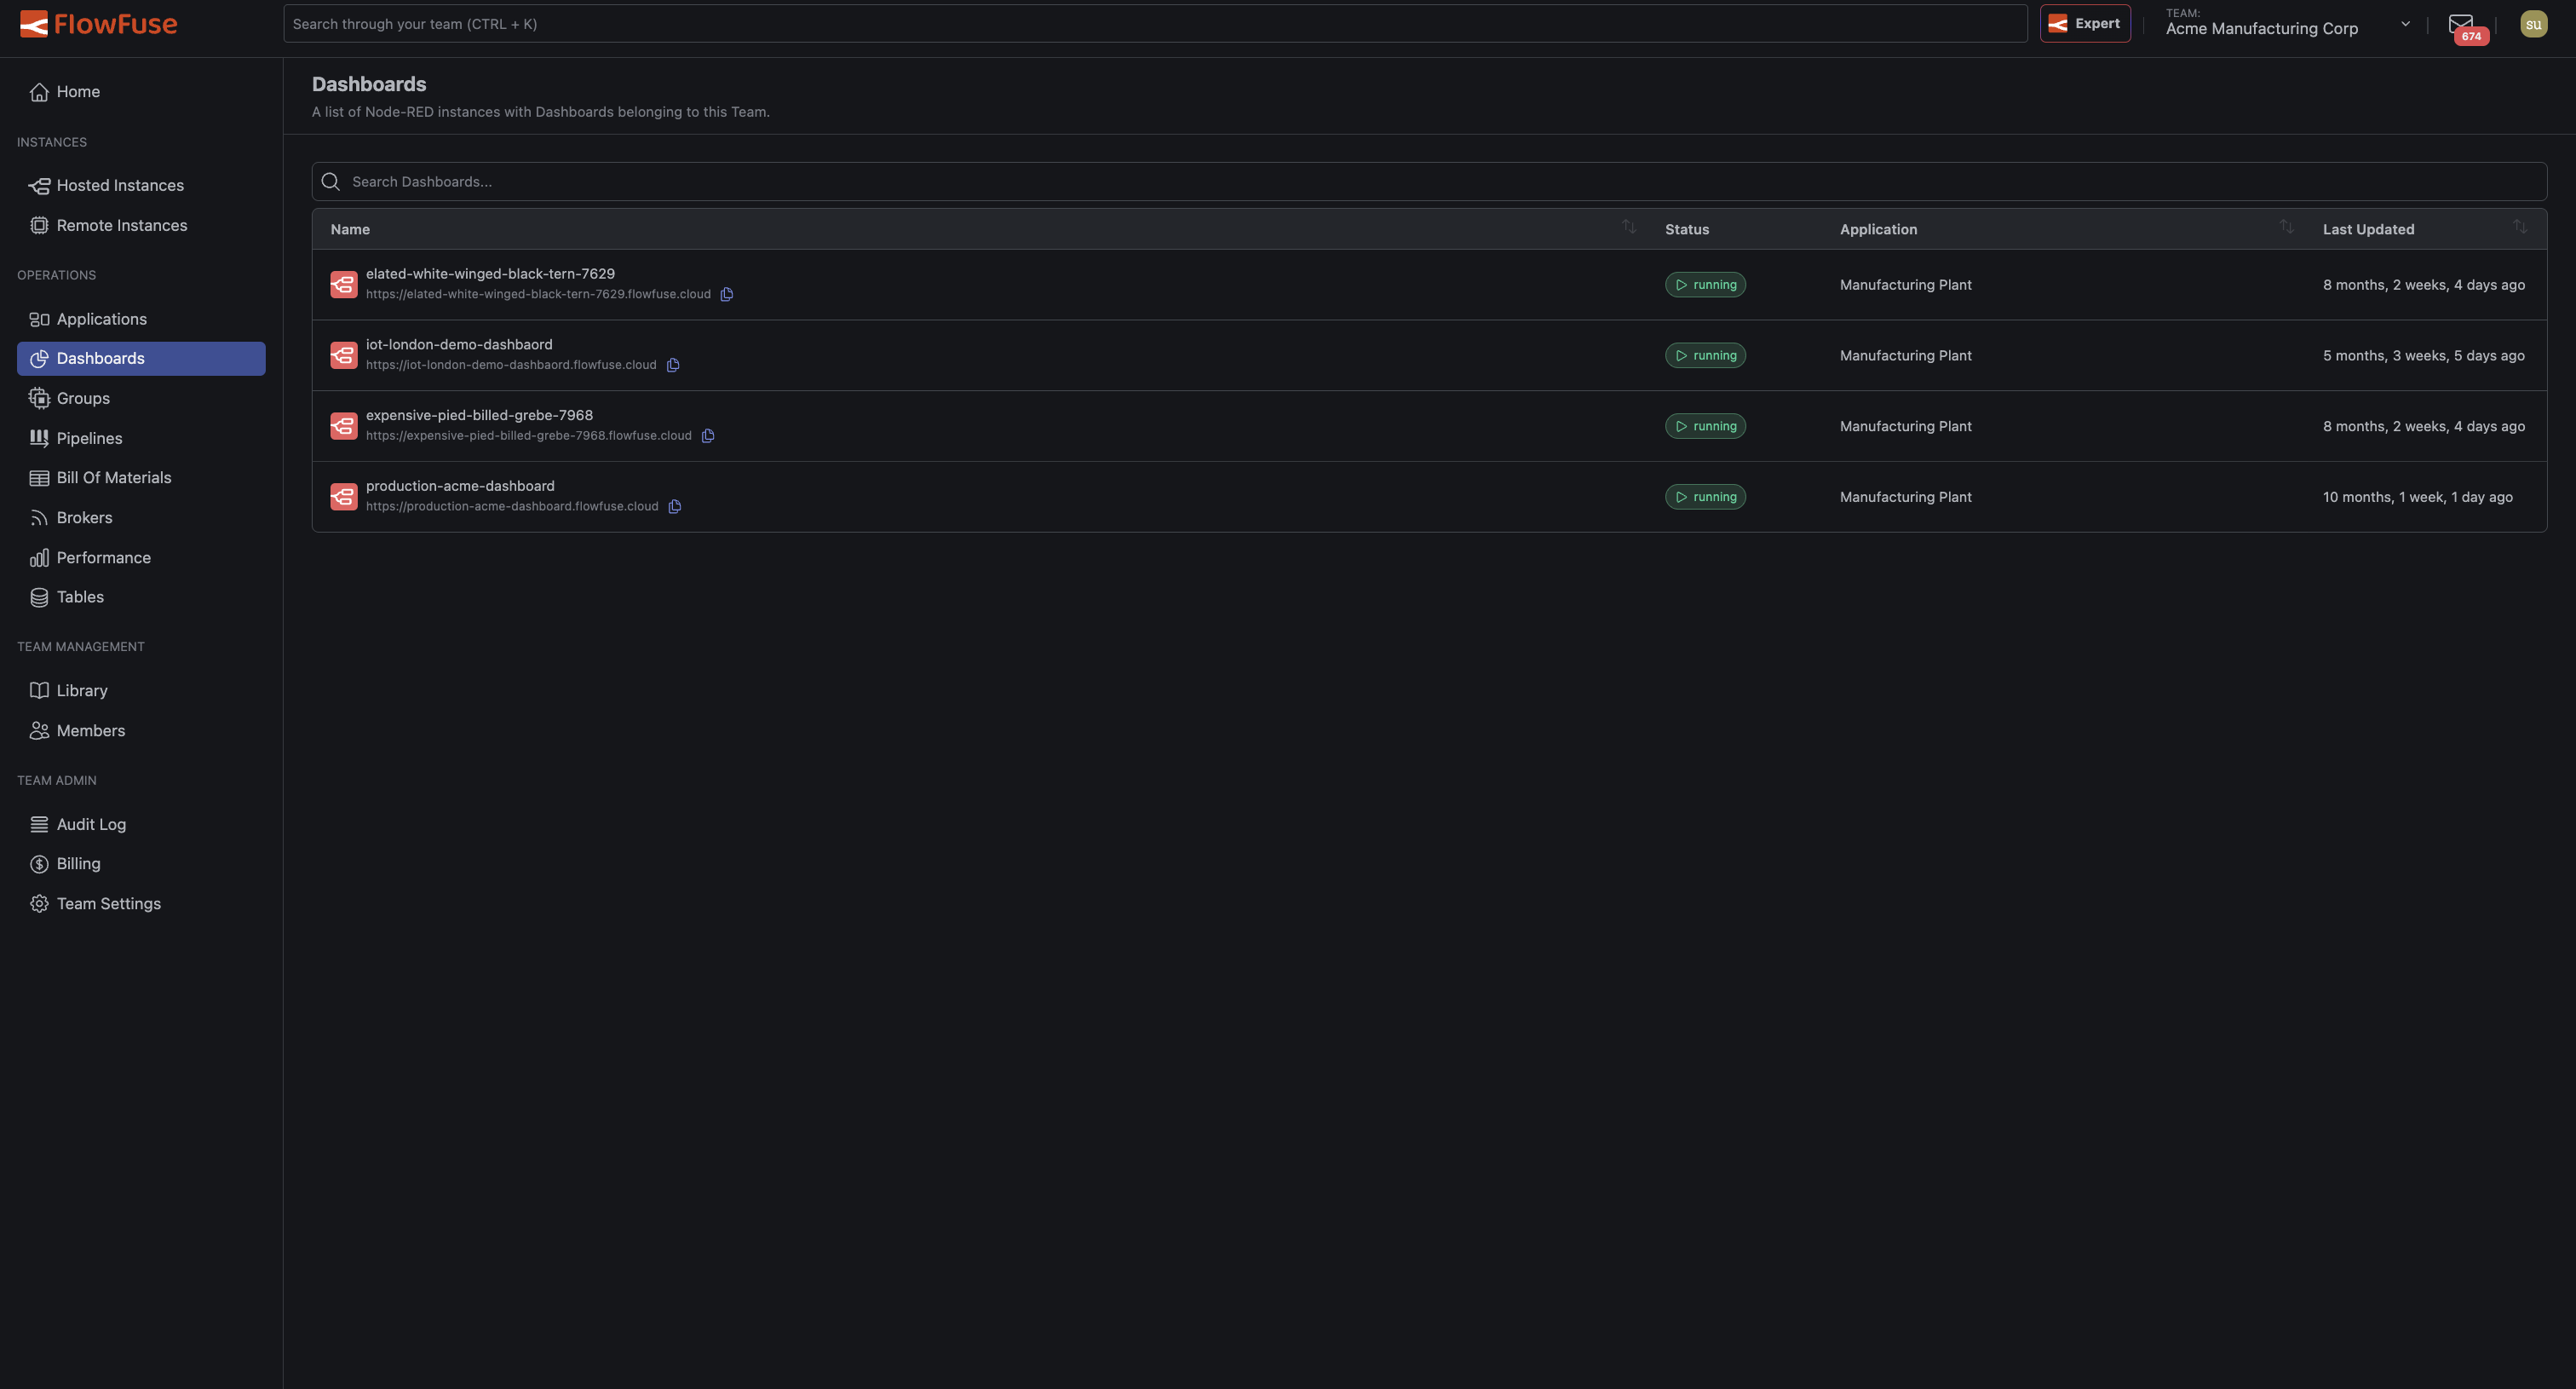
The list shows each instance's name, status, the Application it belongs to, and when its flows were last updated. Click a row to open that instance's Dashboard.
Members with the Dashboard Only role land on this page, scoped to only the instances they have access to.
Application Dashboards
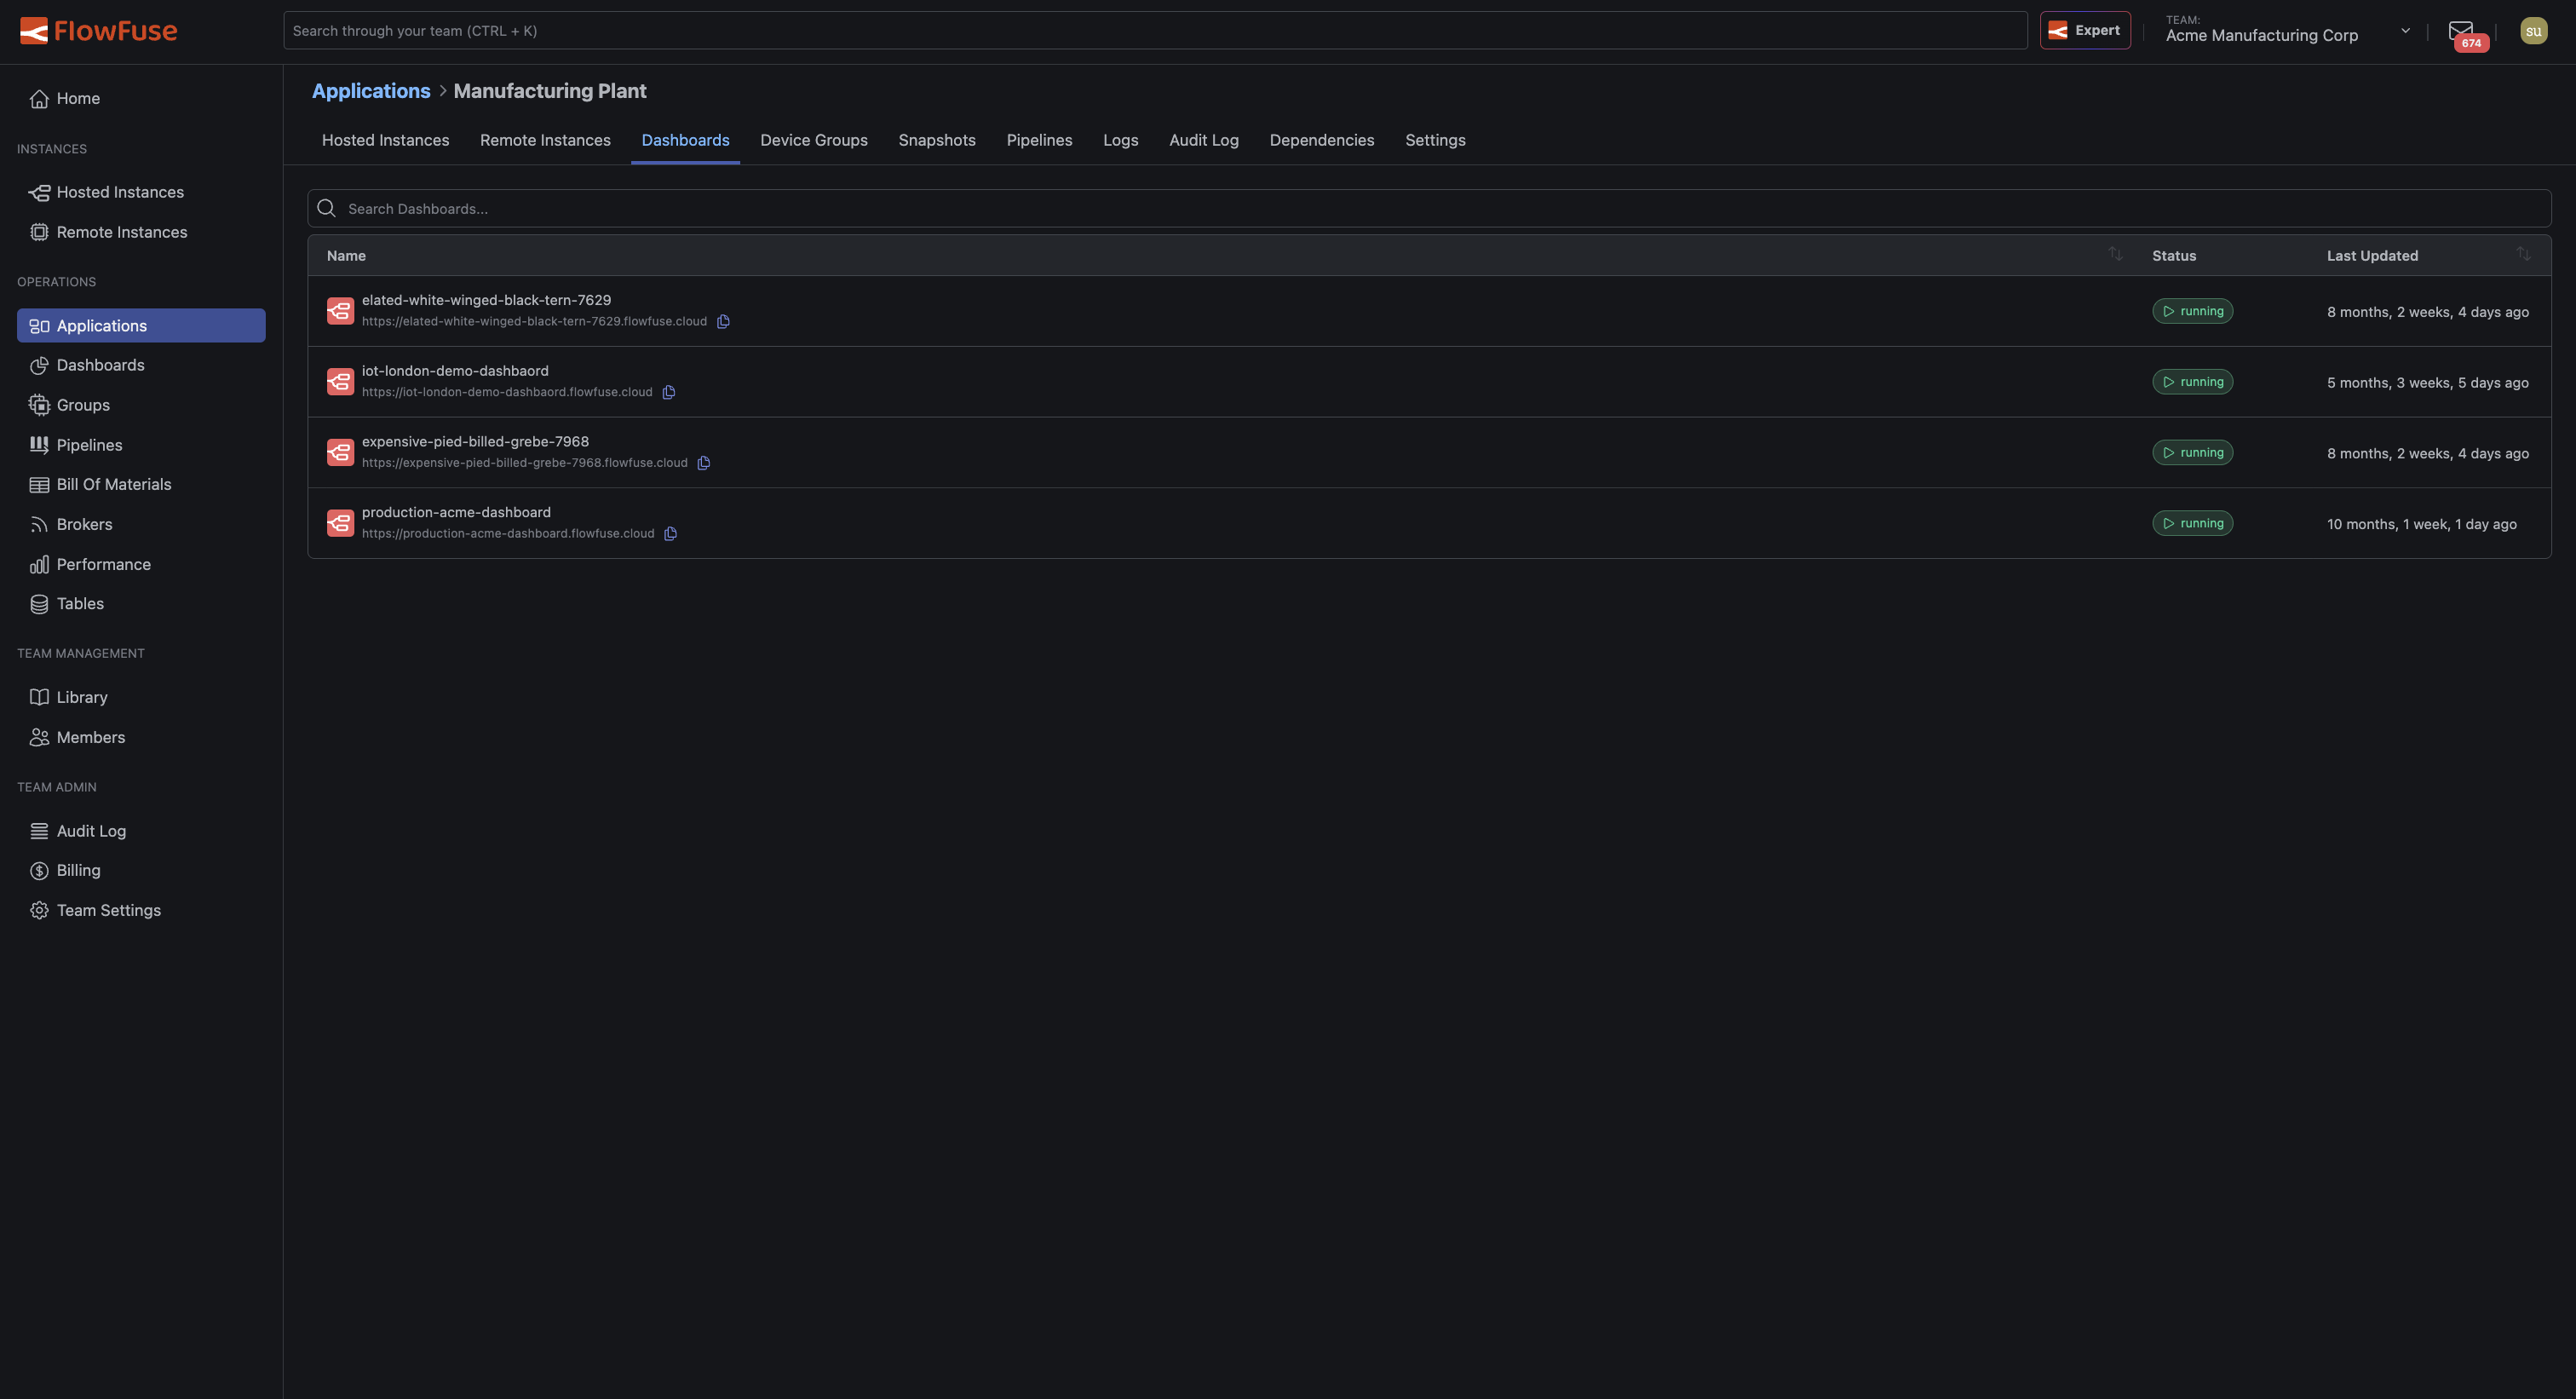
Each Application has its own Dashboards tab, showing only the Dashboards belonging to instances within that Application.
Instance Dashboard Tab
An individual hosted instance's page has a Dashboard tab, for viewing its Dashboard without leaving the instance's context.
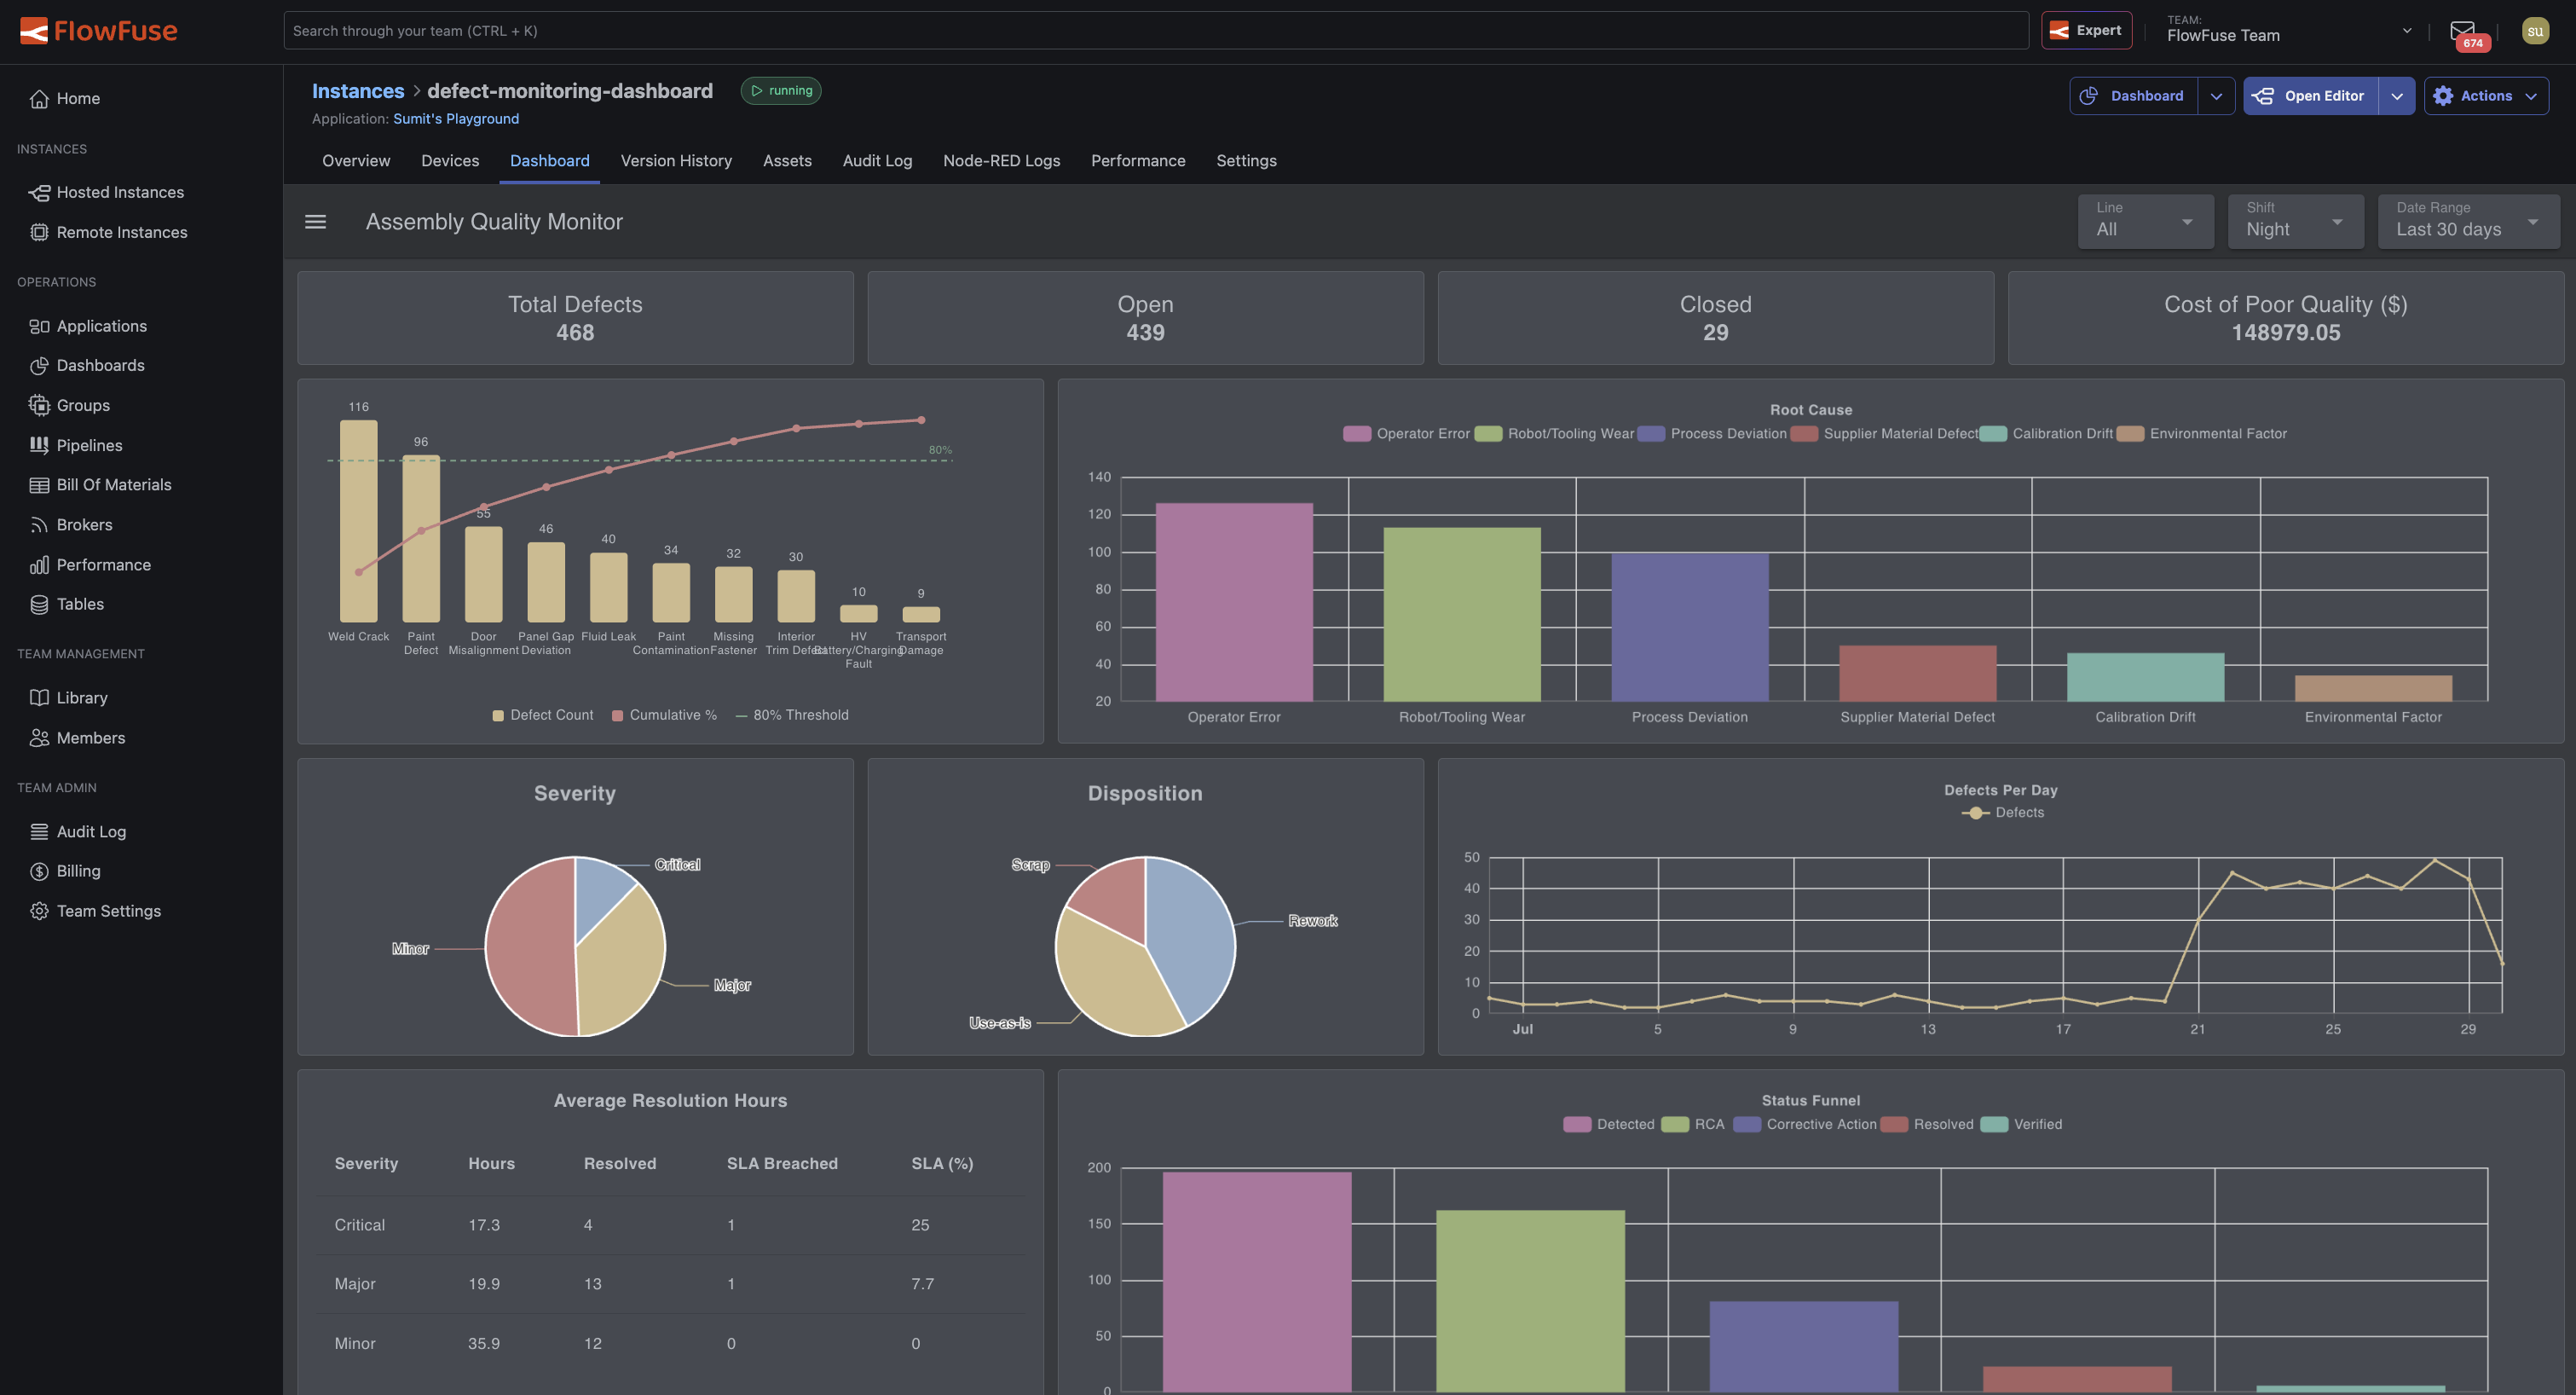
Viewing a Dashboard
Opening a Dashboard displays it embedded inside FlowFuse. A drawer alongside it lists every other Dashboard available in the current scope (Team or Application), with a search box to find one by name. Click any entry in the drawer to switch to that Dashboard directly.
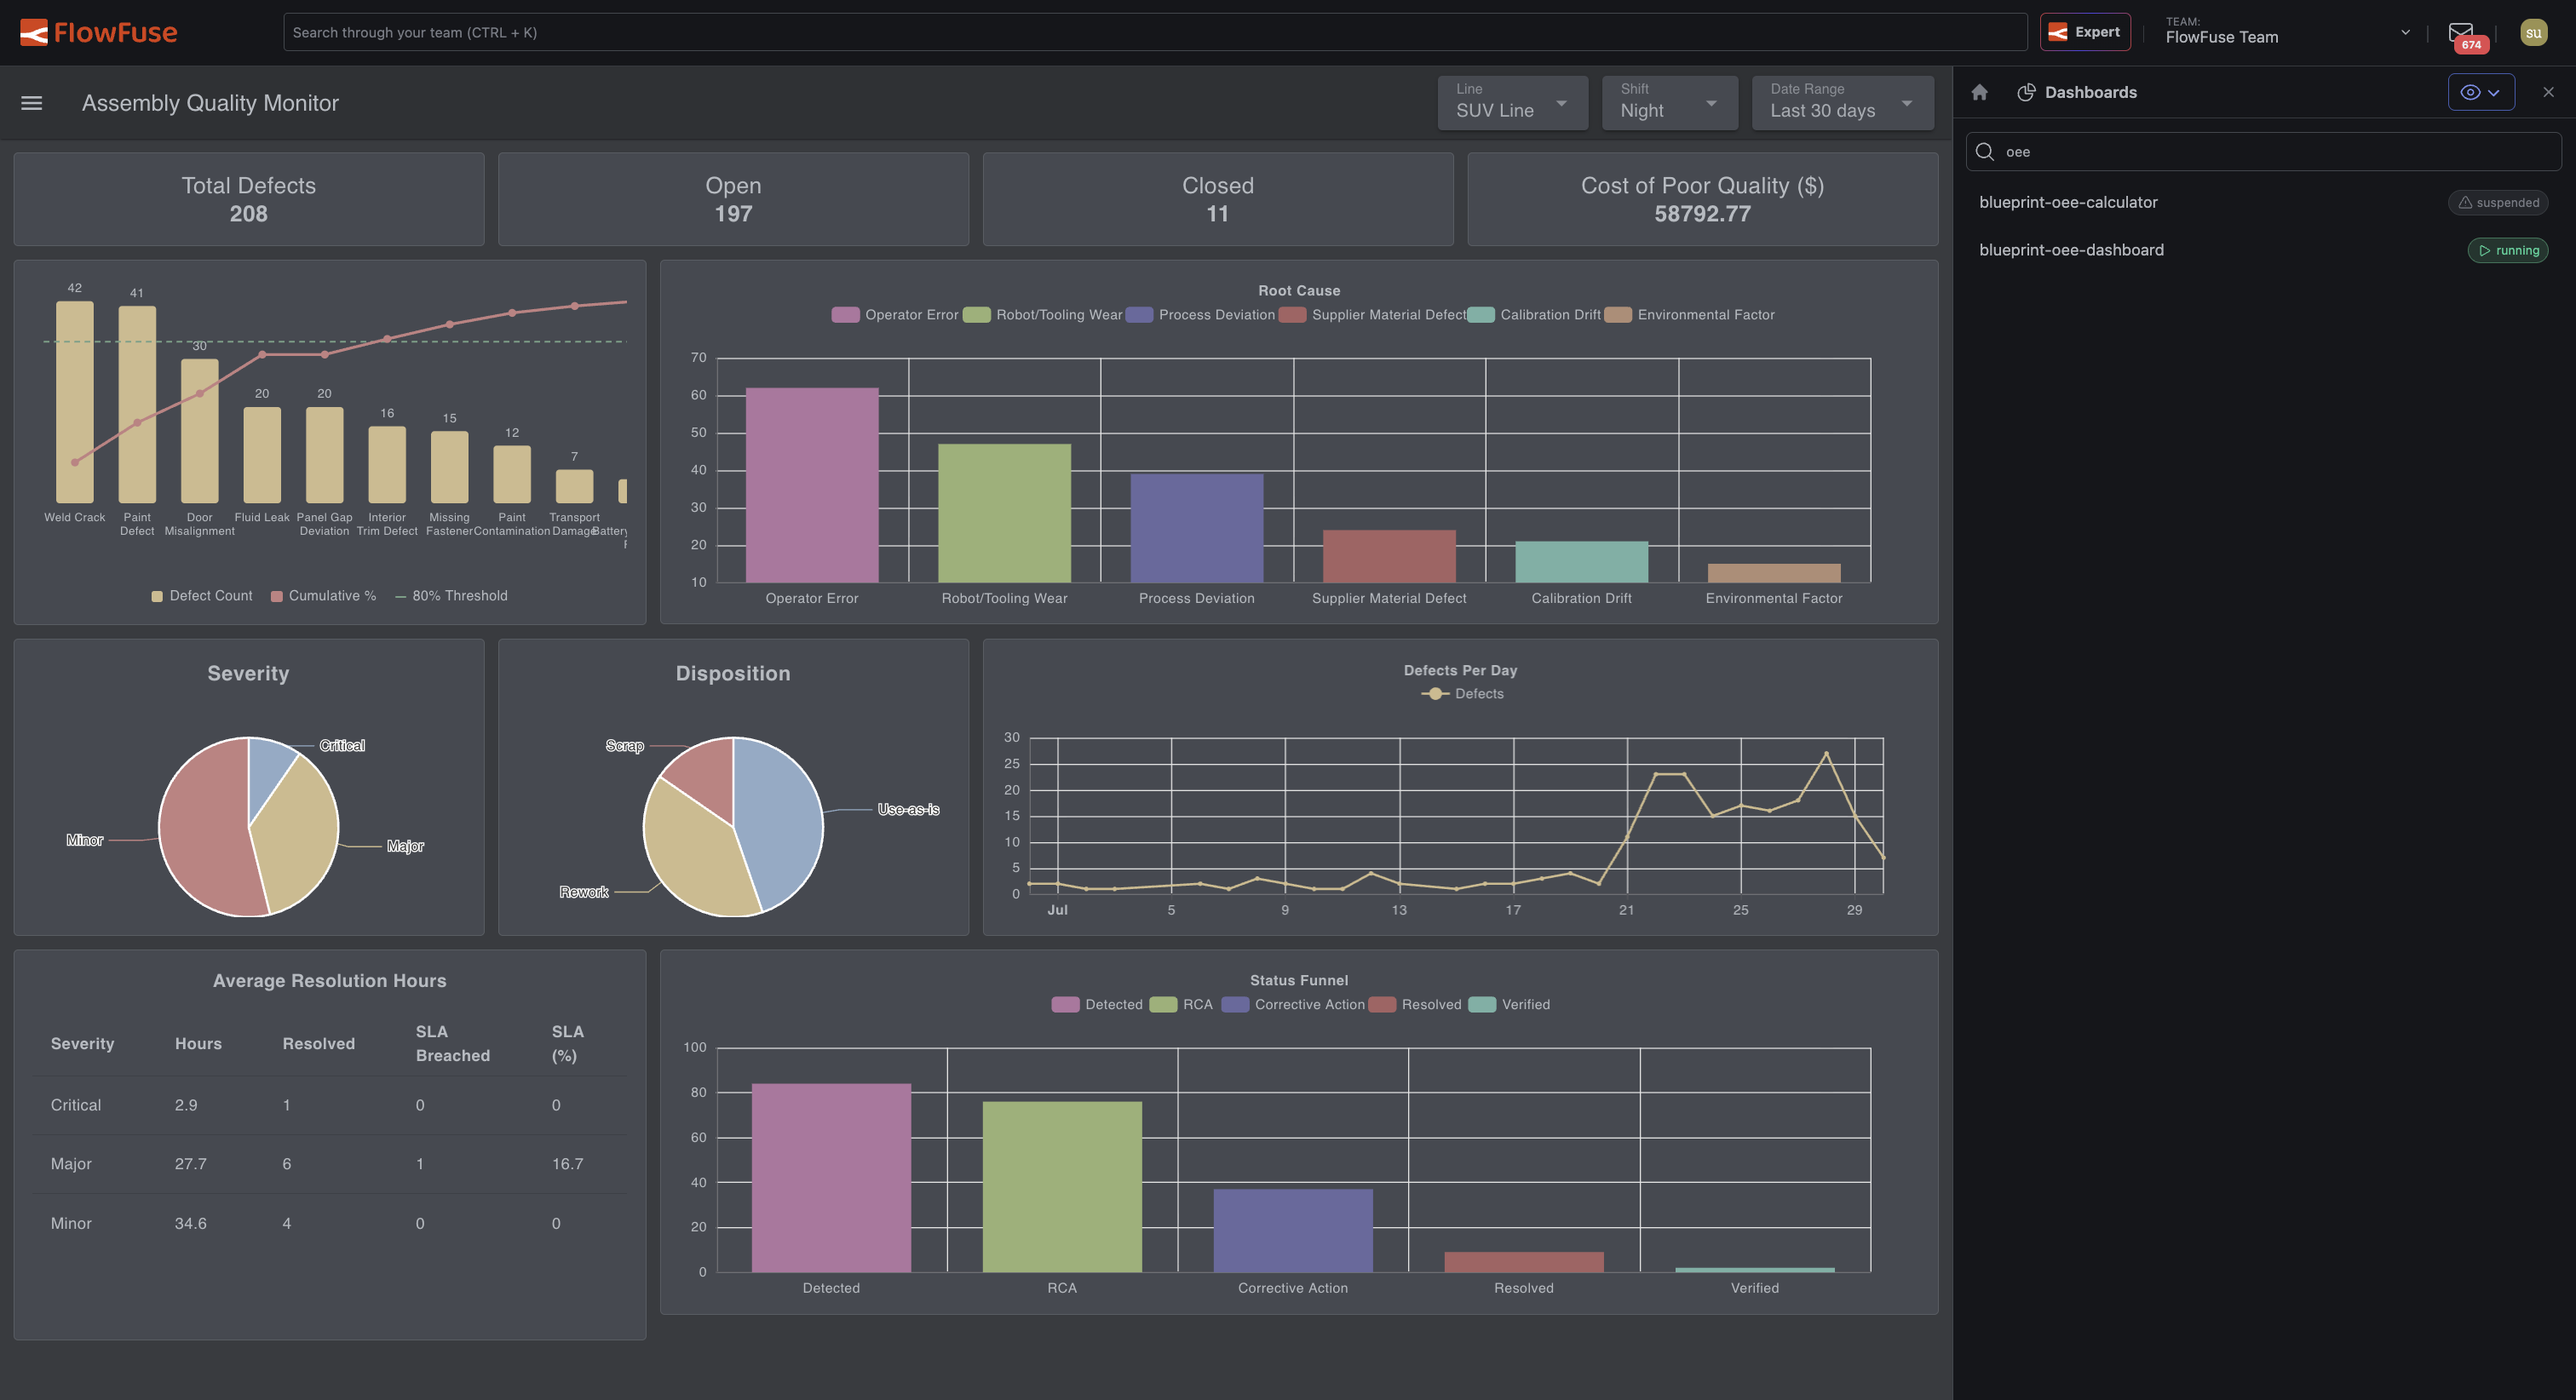
Use the icon in the top-right of the drawer to collapse or reopen it.
To open a Dashboard in its own browser tab instead, use the Dashboard button's dropdown arrow on an instance's page and select Open Direct URL.
Requirements
- The instance must be running for its Dashboard to be viewable.
- The instance must have the FlowFuse Dashboard node installed and configured in its flows. Instances without a Dashboard configured do not appear in these lists.